Cuv’ner
“A commanding view of your test-coverage”
This package provides a command-line tool cuv to visualize coverage metrics in your terminal.
Thus you must first run coverage against your project’s test-suite.
Once you have a .coverage file, you can use the commands documented below (or just type cuv to explore the help).
We utilize several quality open-source packages to achieve this:
coverage by Ned Batchelder
Click by Armin Ronacher / pocoo
pygments by Georg Brandl / pocoo
ansicolors by Giorgos Verigakis
unidiff by Matias Bordese
Code: https://github.com/meejah/cuvner
Docs: https://cuvner.readthedocs.org
Visualize Coverage Data in the Terminal
Overview: cuv graph shows every line of coverage
Files: cuv lessopen shows coverage of each line of a file (tie it directly to less via LESSOPEN env-var for best results).
Diffs: git diff main..HEAD | cuv diff - shows you what lines of a diff are (or are not) covered by tests.
Fun: cuv spark is a short, snappy overview of the entire project’s coverage
cuv graph
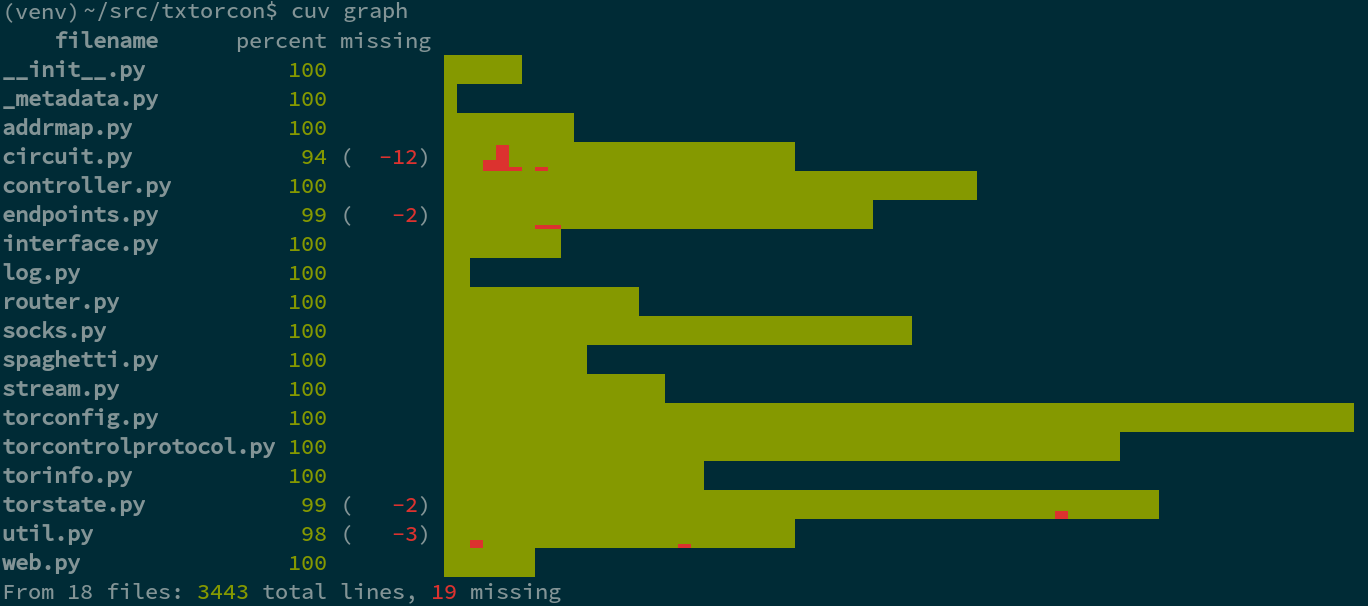
This displays all the files in your project and a histogram-like graph of their coverage. Each character represents 8 lines of code, and uses a group of unicode characters (0x2580 through 0x2587) to draw a little graph. So, if those 8 lines are not covered at all, the graph will be all red; if they’re all covered, it will be all green. If 2 out of the 8 lines are covered, there will be about 25% green and the rest red.
The total size of each file can thus be easily seen (by the length of the histogram part, which wraps to subsequent lines if needed) and an idea of which parts are covered is given.
TODO:
testing on more terminal types
how does it look when using something besides Solarized Dark?
useful, beyond eye-candy?
cuv lessopen
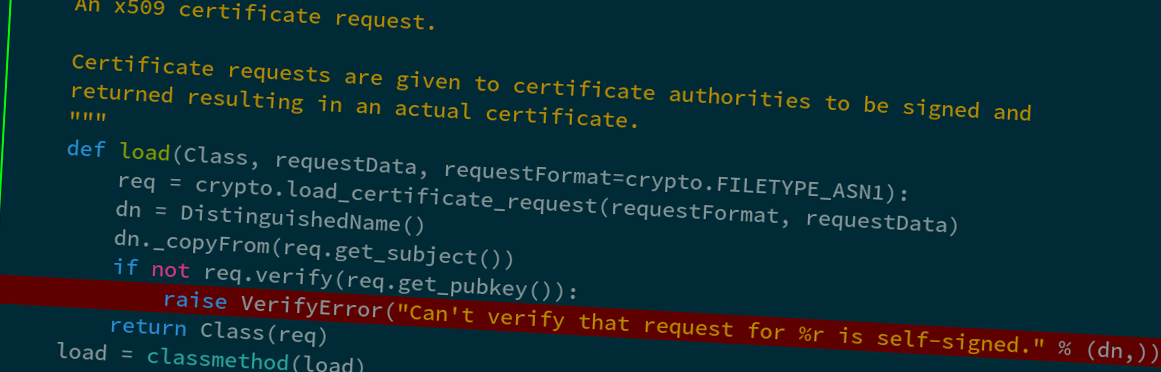
This command is intended to be used via the LESSOPEN environment
variable, which lets you pre-process files that are opened with
less. So, once set up (see the help via cuv lessopen --help)
you can simply run less on any file in your project, and it will
get syntax-highlighted and show you the line-by-line coverage with a
leading green or red mini-verical bar and red background (for
uncovered lines).
A header appears at the top showing the total coverage for this particular file.
TODO:
cuv diff
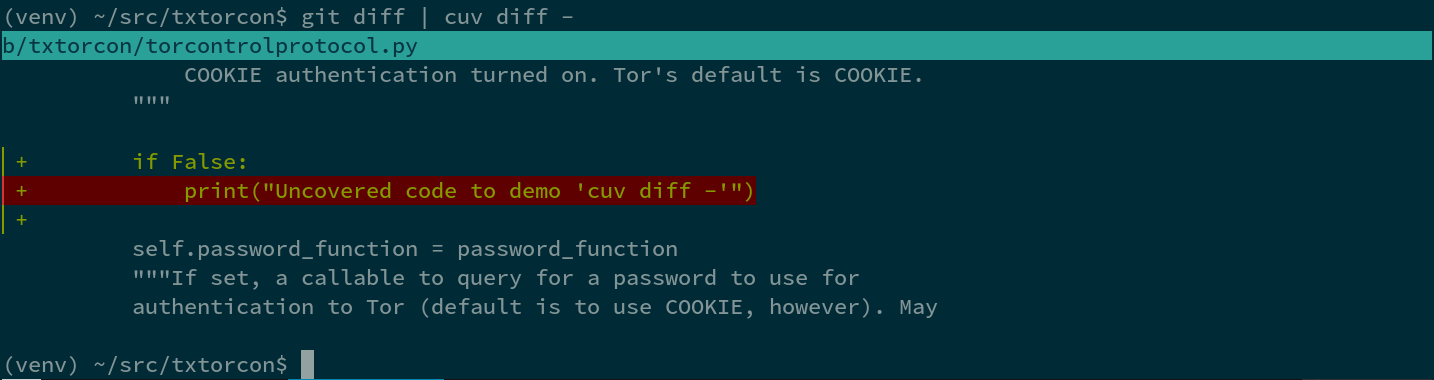
You can pipe a git diff to this and see a colorized version of the
diff in your console. I am using a library called unidiff to read
the actual diff, which so far works quite nicely. That said, I’ve only
tried against the output of Git, like so:
git diff | cuv diff | less
TODO:
colors are unsatisfying, since for added lines they’re pretty much the same as Git’s colored output
maybe make it look more like the “real” underlying diff? (e.g. re-create the @@ and so forth things)
does it work with merge commits?
Pro Tip(tm)
The “uncovered” lines start with a slightly different unicode character than the “covered” lines, so if you’re trying to write tests for uncovered things, you can do this on the “next file that has uncovered things”:
cuv src/file.py | less -p ▌ -j 4
That says (since cuv lessopen is the “default” command) to run
cuv lessopen on src/file.py and then , in less, jump to the
first uncovered line and place it 4 lines below the top of the
screen. You can then hit n in less to go to the next one.
This is precisely what the cuv next command does.
cuv report
Analyzes a diff file (similar to cuv diff) but outputs some brief
statistics instead of the whole diff. For example:
$ git diff master.. | cuv report -
98.7%: 986 covered of 999 added lines (leaving 13 missing)
cuv spark

This shows a “spark-line” sort of thing in the console. It’s not very
useful for big projects (e.g. Twisted), but gives a very quick
overview of the coverage in a small amount of space. Using the same
unicode characters as cuv graph, this represents each file as a
single character, and its percentage coverage is graphed (so you only
get granularity down to about 12.5%).
Background + Terminology
This started out as some experiments in “whole-project coverage visualization”, and then also grew some console tools that I find useful when working with Python code.
I have abandoned the pixel/graphical visualization ideas and proofs-of-concepts into a branch and now this tool is just the console visualizations – which are very useful when working on Python code.
As far as my setup, I am using Debian with a 256-color and unicode capable shell using Solarized Dark color schemes. There are probably bugs with other setups, and to a reasonable extent I’m happy to accept pull-reqeusts fixing these. That said, a unicode-capable shell is a must.
Other Neat Visualizations
Other nice “coverage visualization” tools I’ve run across:
of course, Coverage.py itself comes with a nice HTML visualization
codecov.io browser extension shows coverage live while browsing github
Notes on Tox
If you’re using tox to run tests (and you should, it’s great!) your
coverage files will – depending upon setup – end up in
.tox/envname/.coverage or similar. So, you will either need to use
--coverage to point cuv’ner at the right file, or simply move it to
the top-level of your project for ease-of-use.